The fall trimester has officially come to a close and I'd like to share with you my final project. Each person in our class spent a large portion of the trimester researching an environmental issue of their choosing that is currently affecting our planet. We were then given the task to share our research in the from of either a research paper or a Google Slides screencast. I decided to research endangered species and I created a screencast to help share what I learned and discovered with you all. I hope you enjoy!
Showing posts with label global warming. Show all posts
Showing posts with label global warming. Show all posts
Wednesday, November 18, 2015
Anatomy of Environmental Issues Final Project: Endangered Species
Hello, everyone!
The fall trimester has officially come to a close and I'd like to share with you my final project. Each person in our class spent a large portion of the trimester researching an environmental issue of their choosing that is currently affecting our planet. We were then given the task to share our research in the from of either a research paper or a Google Slides screencast. I decided to research endangered species and I created a screencast to help share what I learned and discovered with you all. I hope you enjoy!
The fall trimester has officially come to a close and I'd like to share with you my final project. Each person in our class spent a large portion of the trimester researching an environmental issue of their choosing that is currently affecting our planet. We were then given the task to share our research in the from of either a research paper or a Google Slides screencast. I decided to research endangered species and I created a screencast to help share what I learned and discovered with you all. I hope you enjoy!

Thursday, November 5, 2015
Global Climate Change Unit
Over the past few weeks, my Honors Environmental Science class has been learning about climate change and its effect on our planet. We started the unit with a short, in-class activity on El Niño. It was in this activity that the class developed a thorough understanding of the severity of climate change along with the difference between climate and weather. Weather is the measure of daily temperature, precipitation, humidity, etc. while climate is the change in weather patterns over extended periods of time. Climate change and the warming of the Earth’s atmosphere also create stronger storms that occur more frequently. This was an incredible way to start out the unit as it was very eye-opening.
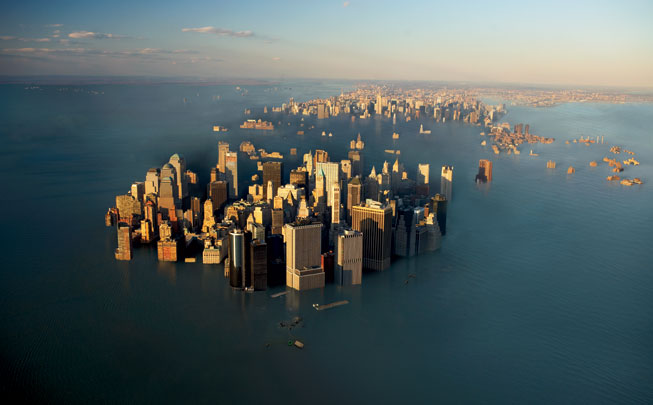
After completing the El Niño activity, two climate specialists came to speak with our class; Andra Reed (M.S.) and Dr. Greg Garner (PhD) of the Pennsylvania State University talked about their work studying climate change. The presentation began with Andra Reed where she explained her work studying the effects rising sea levels have on New York City. She went into detail about how climate scientists measure changes in the sea level as well as how they predict the future climate of the region. Her research was even featured in famous publications such as The New York Times. The presentation continued with Dr. Garner. He explained the work he does with studying air quality. Similarly to Andra Reed, Dr. Garner and his team use similar methods to arrive at their conclusions.
We then looked over a climate change presentation created by the Department of Biology and the Department of Geology at West Chester University. The presentation made it so that we were interns working for an imaginary senator. Our goal was to educate our senator on climate change for legislation he was about to pass and we had to start at square one. Here’s what we learned.
Climate was the first thing we learned about; it is the pattern of precipitation, temperature, and wind in a particular area. Climate quickly lead into the discussion on climate change. Climate change is when climate patterns change in time or space. For example, a change in time would be the winter months getting warmer. A change in space would be the occurrence of extreme weather events in areas where they typically do not occur. Climate change is a difficult thing to study, however, because there are so many factors. Climate can be studied in periods of tens, hundreds, or thousands of years and on the local, regional, national, or global levels.
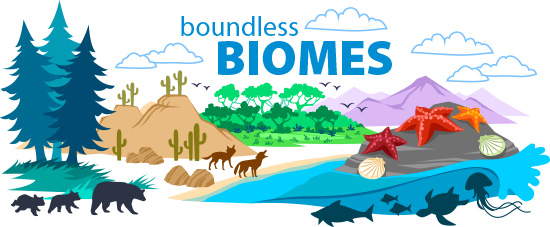
We then learned just how serious climate change is. Climate determines things such as the frequency of extreme weather events, the severity of droughts, the state of human-managed ecosystems like agricultural fields, and the location of biomes (large terrestrial ecosystems). Following our lesson on the severity of the issue, we learned what is causing climate change.
We discovered that temperatures are rising on Earth. While it is normal for our planet to go through gradual stages of warming and cooling, the recent spike in temperature over the past few decades has been rather extreme and far out of proportion compared to other warming and cooling cycles. There is a direct correlation between the rising temperatures and the rise of carbon dioxide. As the temperatures on the planet rise, so do the levels of carbon dioxide. This is because carbon dioxide is a type of greenhouse gas. Greenhouse gases are incredibly important; a portion of these gases get trapped in the Earth’s atmosphere, thus making the planet habitable for life. This is a process known as the greenhouse effect. Greenhouse gasses enter the atmosphere, reflect off the Earth’s surface, and the some go back off into space and some get trapped in by our atmosphere. without the greenhouse effect, humans and many other species would certainly go extinct. The problem is, humans are producing carbon dioxide at incredibly high rates. All this these extra man-made greenhouse gas emissions also get trapped into our atmosphere, and therefore also help raise the temperature of the Earth.

Human activities such as driving cars, flying planes, moving trains, heating homes, lighting streets, growing food, etc all contribute to more greenhouse gas emissions. The results could be (and will be if we do not stop) catastrophic. Just a one degree rise in temperature could cause massive sea level rises, more extreme storms, and the shift of biomes. Rises in temperature can make Pennsylvania feel like Georgia and Georgia feel like a tropical rainforest. Overall, the effects of climate change are detrimental and serious action needs to be taken in order to make a meaningful change in the world. This is our planet and we need to protect it.
After completing the El Niño activity, two climate specialists came to speak with our class; Andra Reed (M.S.) and Dr. Greg Garner (PhD) of the Pennsylvania State University talked about their work studying climate change. The presentation began with Andra Reed where she explained her work studying the effects rising sea levels have on New York City. She went into detail about how climate scientists measure changes in the sea level as well as how they predict the future climate of the region. Her research was even featured in famous publications such as The New York Times. The presentation continued with Dr. Garner. He explained the work he does with studying air quality. Similarly to Andra Reed, Dr. Garner and his team use similar methods to arrive at their conclusions.
We then looked over a climate change presentation created by the Department of Biology and the Department of Geology at West Chester University. The presentation made it so that we were interns working for an imaginary senator. Our goal was to educate our senator on climate change for legislation he was about to pass and we had to start at square one. Here’s what we learned.
Climate was the first thing we learned about; it is the pattern of precipitation, temperature, and wind in a particular area. Climate quickly lead into the discussion on climate change. Climate change is when climate patterns change in time or space. For example, a change in time would be the winter months getting warmer. A change in space would be the occurrence of extreme weather events in areas where they typically do not occur. Climate change is a difficult thing to study, however, because there are so many factors. Climate can be studied in periods of tens, hundreds, or thousands of years and on the local, regional, national, or global levels.
We then learned just how serious climate change is. Climate determines things such as the frequency of extreme weather events, the severity of droughts, the state of human-managed ecosystems like agricultural fields, and the location of biomes (large terrestrial ecosystems). Following our lesson on the severity of the issue, we learned what is causing climate change.
We discovered that temperatures are rising on Earth. While it is normal for our planet to go through gradual stages of warming and cooling, the recent spike in temperature over the past few decades has been rather extreme and far out of proportion compared to other warming and cooling cycles. There is a direct correlation between the rising temperatures and the rise of carbon dioxide. As the temperatures on the planet rise, so do the levels of carbon dioxide. This is because carbon dioxide is a type of greenhouse gas. Greenhouse gases are incredibly important; a portion of these gases get trapped in the Earth’s atmosphere, thus making the planet habitable for life. This is a process known as the greenhouse effect. Greenhouse gasses enter the atmosphere, reflect off the Earth’s surface, and the some go back off into space and some get trapped in by our atmosphere. without the greenhouse effect, humans and many other species would certainly go extinct. The problem is, humans are producing carbon dioxide at incredibly high rates. All this these extra man-made greenhouse gas emissions also get trapped into our atmosphere, and therefore also help raise the temperature of the Earth.

Human activities such as driving cars, flying planes, moving trains, heating homes, lighting streets, growing food, etc all contribute to more greenhouse gas emissions. The results could be (and will be if we do not stop) catastrophic. Just a one degree rise in temperature could cause massive sea level rises, more extreme storms, and the shift of biomes. Rises in temperature can make Pennsylvania feel like Georgia and Georgia feel like a tropical rainforest. Overall, the effects of climate change are detrimental and serious action needs to be taken in order to make a meaningful change in the world. This is our planet and we need to protect it.
Image 1 Source: https://toryardvaark.files.wordpress.com/2010/11/flooded-new-york.jpg
Image 2 Source: https://askabiologist.asu.edu/sites/default/files/image/article/2014/biomes-world.jpg
Image 3 Source: http://72abfb7c1a8a714119014a3d306595cd09781b35fe13ebdb4f63.r27.cf2.rackcdn.com/4C8755B4-B5C2-412D-BB43-16FF536A7514.jpg
Image 2 Source: https://askabiologist.asu.edu/sites/default/files/image/article/2014/biomes-world.jpg
Image 3 Source: http://72abfb7c1a8a714119014a3d306595cd09781b35fe13ebdb4f63.r27.cf2.rackcdn.com/4C8755B4-B5C2-412D-BB43-16FF536A7514.jpg
Sunday, October 25, 2015
Global Climate Change Activity Overview
Over the past week in my Honors Environmental Science class, we have been learning about all things related to climate and climate change. We started out the week discussing the difference between weather and climate as well as discovering the formation of El Niño and La Niña. We then met with Andra Reed (M.S.) and Dr. Greg Garner (PhD) of the Pennsylvania State University where they explained the research they do in regards to climate change and the health of the environment. To conclude our week, we completed a four part lab activity about climate change. An overview of what we learned is below.
We first learned about the difference between climate and weather. Weather is the measure of day-to-day environmental conditions. Elements such as daily temperatures, precipitation amounts, barometric pressure, humidity, etcetera are all examples of weather. Climate, on the other hand, in the measure of weather-related trends over extended periods of time. The change in weather in a particular region over a hundred or a thousand years is an example of climate.
We then learned about the creation of El Niño and La Niña. El Niño occurs in the Pacific Ocean and directly affects the western portion of the United States. The interaction of heat between the atmosphere and the ocean bring cooler, wetter conditions to the South while producing the warmer, drier conditions everywhere else. La Niña produces the opposite effect. It also occurs in the Pacific Ocean, but it causes warmer, drier conditions in the South while creating cooler, wetter conditions everywhere else instead. We discussed El Niño specifically since it is currently occurring, but to a much more extreme extent. Due to the warming of the Earth’s climate (climate change), these weather patterns are happening much more frequently with significantly greater power.

We first learned about the difference between climate and weather. Weather is the measure of day-to-day environmental conditions. Elements such as daily temperatures, precipitation amounts, barometric pressure, humidity, etcetera are all examples of weather. Climate, on the other hand, in the measure of weather-related trends over extended periods of time. The change in weather in a particular region over a hundred or a thousand years is an example of climate.
We then learned about the creation of El Niño and La Niña. El Niño occurs in the Pacific Ocean and directly affects the western portion of the United States. The interaction of heat between the atmosphere and the ocean bring cooler, wetter conditions to the South while producing the warmer, drier conditions everywhere else. La Niña produces the opposite effect. It also occurs in the Pacific Ocean, but it causes warmer, drier conditions in the South while creating cooler, wetter conditions everywhere else instead. We discussed El Niño specifically since it is currently occurring, but to a much more extreme extent. Due to the warming of the Earth’s climate (climate change), these weather patterns are happening much more frequently with significantly greater power.

The following day, we met with Andra Reed (M.S.) and Dr. Greg Garner (PhD) from the Pennsylvania State University. The presentation began with Andra Reed telling us all about her study of affect climate change and rising ocean levels will have on New York City. She cited the effects and damage Hurricane Sandy had on the city to convey just how serious this issues is. Her studies about Hurricane Sandy were even featured in reputable news organizations such as The New York Times. She explained to us how even just a one degree celsius increase in global temperatures can have catastrophic effects. The presentation continued with Dr. Greg Garner. He explained to us the work he does with studying air and air pollution. In particular, he explained how carbon dioxide emissions can create heavily polluted air Dr. Garner showed us a recent study on the Baltimore region to show us the seriousness of air pollution and how it damages not only the environment, but also ourselves.
We then began a two-day global climate change lab activity. Everyone in my class was evenly divided into four separate groups - one group per activity in the lab. On the first day, each group worked through their specific lab activity in the packet. One the second day, the groups were reorganized so that each person in the group completed a different activity than their group members. The second-day groups helped each other to complete all the lab activities in the packet. Below is an overview of each activity.
The first activity provided readers with a graph displaying the average temperature of El Niño years. It then asked the reader to explain how weather differed from climate and how climate change affected the extremity of El Niño. It also asked the reader to examine a statement from an imaginary classmate stating that the graph only represented weather and, therefore, it could not prove any change in climate. My group came up with the response that weather affects climate over time. On the first section of the graph, El Niño events are significantly smaller than events on the second portion of the graph. Within the second portion of the graph, the average temperature is significantly higher and El Niño events occur more frequently. We also concluded that the classmate was wrong.
The second activity provided the reader with three graphs displaying the changes in greenhouse gas levels (carbon dioxide, methane, and nitrous oxide) from the beginning of the Industrial Revolution in 1850 to today. It then asked readers to chart the amount of carbon dioxide in parts per million from the year 1850 to 2100. My group concluded that levels of greenhouse gasses such as carbon dioxide have been steadily increasing since the start of the Industrial Revolution. We also determined the humans are primarily responsible for this increase through our use of fossil fuels and that even small increases of carbon dioxide levels can greatly affect the Earth’s climate.
The third activity provided reader with a list of facts in regards to cars, their fuel consumption, and how many pounds of carbon dioxide are released into the atmosphere per gallon of gasoline burned. It then provided readers with a scenario. The packet included a map of 25 students’ houses in an imaginary school district. It then provided the distances each student needed to drive every day in order to get to school. The activity posed the question of whether it would be more environmentally friendly for every student to drive to school or take the bus. My group did the math and made all the necessary calculations. We determined that it is significantly more environmentally friendly for students to take the bus each day. The then calculated how many tons of carbon dioxide could be prevented from being emitted into the atmosphere each week if all 250 students in the district took the bus each day. We were amazed by the fact that students could prevent 743.4 tons of carbon dioxide from being emitted each week just by taking the bus. This activity was particularly eye-opening because it showed us just how easy it is to make a meaningful difference.
The fourth activity provided readers with a graph charting the change in the Earth’s temperatures over the past 2,000 years. We saw that the Earth is about to reach the highest temperature it has ever seen in the past 10,000 years just due to the greenhouse gas emissions humans have produced over the past 150 years. My group concluded that even the slightest change in temperature can cause devastating effects such as sea level rises and loss of glaciers.
Overall, this week in Honors Environmental Science was very interesting. Climate change is a serious problem that needs to be addressed. This activity really put things into perspective. Climate change is happening now and has a detrimental impact on our lives. Storms are occurring more frequently and with more severe effects. Sea levels are rising and damaging our cities and our coastal habitats. We need to make the necessary changes in our lifestyle to prevent any further damage and protect our planet from the destruction we are causing.
We then began a two-day global climate change lab activity. Everyone in my class was evenly divided into four separate groups - one group per activity in the lab. On the first day, each group worked through their specific lab activity in the packet. One the second day, the groups were reorganized so that each person in the group completed a different activity than their group members. The second-day groups helped each other to complete all the lab activities in the packet. Below is an overview of each activity.
The first activity provided readers with a graph displaying the average temperature of El Niño years. It then asked the reader to explain how weather differed from climate and how climate change affected the extremity of El Niño. It also asked the reader to examine a statement from an imaginary classmate stating that the graph only represented weather and, therefore, it could not prove any change in climate. My group came up with the response that weather affects climate over time. On the first section of the graph, El Niño events are significantly smaller than events on the second portion of the graph. Within the second portion of the graph, the average temperature is significantly higher and El Niño events occur more frequently. We also concluded that the classmate was wrong.
The second activity provided the reader with three graphs displaying the changes in greenhouse gas levels (carbon dioxide, methane, and nitrous oxide) from the beginning of the Industrial Revolution in 1850 to today. It then asked readers to chart the amount of carbon dioxide in parts per million from the year 1850 to 2100. My group concluded that levels of greenhouse gasses such as carbon dioxide have been steadily increasing since the start of the Industrial Revolution. We also determined the humans are primarily responsible for this increase through our use of fossil fuels and that even small increases of carbon dioxide levels can greatly affect the Earth’s climate.
The third activity provided reader with a list of facts in regards to cars, their fuel consumption, and how many pounds of carbon dioxide are released into the atmosphere per gallon of gasoline burned. It then provided readers with a scenario. The packet included a map of 25 students’ houses in an imaginary school district. It then provided the distances each student needed to drive every day in order to get to school. The activity posed the question of whether it would be more environmentally friendly for every student to drive to school or take the bus. My group did the math and made all the necessary calculations. We determined that it is significantly more environmentally friendly for students to take the bus each day. The then calculated how many tons of carbon dioxide could be prevented from being emitted into the atmosphere each week if all 250 students in the district took the bus each day. We were amazed by the fact that students could prevent 743.4 tons of carbon dioxide from being emitted each week just by taking the bus. This activity was particularly eye-opening because it showed us just how easy it is to make a meaningful difference.
The fourth activity provided readers with a graph charting the change in the Earth’s temperatures over the past 2,000 years. We saw that the Earth is about to reach the highest temperature it has ever seen in the past 10,000 years just due to the greenhouse gas emissions humans have produced over the past 150 years. My group concluded that even the slightest change in temperature can cause devastating effects such as sea level rises and loss of glaciers.
Overall, this week in Honors Environmental Science was very interesting. Climate change is a serious problem that needs to be addressed. This activity really put things into perspective. Climate change is happening now and has a detrimental impact on our lives. Storms are occurring more frequently and with more severe effects. Sea levels are rising and damaging our cities and our coastal habitats. We need to make the necessary changes in our lifestyle to prevent any further damage and protect our planet from the destruction we are causing.
Image Source: NOAA
Subscribe to:
Posts (Atom)