Sunday, December 13, 2015

Ecosystem Diversity


Today in class, we watched a video about tropical rainforests. It was quite intriguing; we learned about their importance. The rainforest is the Earth’s most diverse ecosystem and is home to over five million species (over half the world’s species). This really caught my attention, so I did some further digging. The rainforest is a rather stable environment; its climate remains warm and humid all year round. The rainforest is also located on or near the equator, so it receives the most rainfall out of all the other ecosystems on the planet. These two factors contribute to its surplus of biodiversity. Organisms don’t only live in the rainforest, they thrive. If you want to dig even deeper than I did, you can read the information here.  


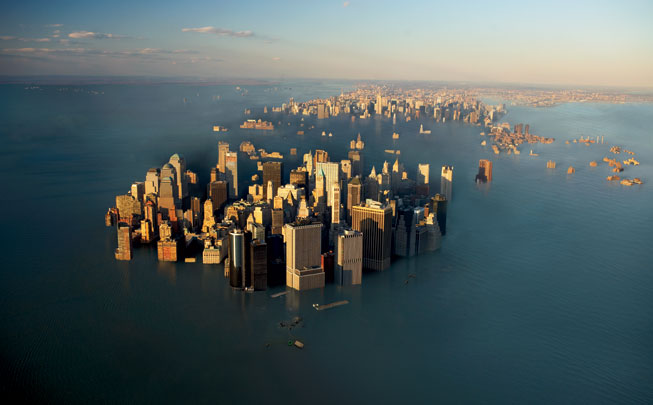
Not only are rainforests rich in biodiversity, they’re also essential climate stabilizers. Due to their size and insanely large number of trees and tree species, rainforests take in lots and lots of carbon. While humans breathe in oxygen and breathe out carbon dioxide, trees do the opposite. The rainforests require carbon to survive and store a significant amount, thus helping to lower the levels of carbon in the atmosphere. This function is becoming increasingly more important as the Earth experiences climate change. Too much carbon in the atmosphere is causing the Earth to heat up and any help alleviating these high carbon levels helps to stabilize the atmosphere. With this being said, deforestation is a huge problem. If we keep cutting down the rainforests of the world, we’ll be releasing all of the carbon rainforests help to reduce back into the atmosphere. In order to ensure the health of our planet, we must preserve and protect the rainforest. 


Given the fact that the tropical rainforest is the most biologically diverse ecosystem on the planet, lots of research is conducted and data collected there. Regardless of where an ecosystem exists, they all have similarities in one way or another. Therefore, the data collected in a tropical rainforest in regards to biodiversity can hold true in other ecosystems as well, such as Yellowstone National Park. Conservationists, researchers, or park rangers can use data gathered in the rainforest to guide the work they do in their ecosystem. For example, in the video we watched, park rangers worked to repopulate wolves back into the Yellowstone ecosystem. They noticed a change after they were eradicated from the region and knew that, in order to preserve the health of Yellowstone, they needed to reintroduce wolves, the top predators, back into the ecosystem. If needed, the park rangers could’ve reviewed data from rainforest to back up their decision and further support their cause. Overall, I really enjoyed this video and it helped me open up my eyes to the world around me.


Image 1: 
http://www.onemeteratatime.org/wp-content/uploads/rainforest1.jpg
Image 2:
http://www.srl.caltech.edu/personnel/krubal/rainforest/Edit560s6/www/images/where/whemap.gif
Image 3: http://cf067b.medialib.glogster.com/media/d6/d6ac6cc6f34531b93db1a14f48867d9049f5c4dd50d6141bde7b392cd86c33b3/rainforest-carbon-cycle-jpg.jpg
Image 4:
http://www.nathab.com/uploaded-files/carousels/TRIPS/Yellowstone-Wolf-Quest/US-National-Parks-Yellowstone-Wolf-Quest-1-wolves.jpg

Monday, December 7, 2015

Ecology Lab

Over the past few days, my Honors Environmental Science class has been learning about ecosystems and their complexity. Ecosystems have a lot of different components, and to help give us a better understanding as well as wrap up the section, we completed an ecology lab in class. For this lab, we used an online simulator of a make-believe ecosystem and completed a series of activities related to it.

The lab was broken up into two sections: one on producers and the other on food webs. For the producer section, we were given a scenario where an ecosystem was recently destroyed by a wildfire and two plants were re-emerging back into the environment. We had to use the simulator to see what would happen to these two plants as they began to grow and re-populate the ecosystem without any consumers eating them. Both plant populations started at 5,000 organisms. Over a 100 day simulation, the population of Plant A doubled in size to 10,000 organisms while Plant B went extinct. Through this simulation, I learned that co-dominance is very difficult to achieve and therefore, must be quite rare within nature. I also learned that certain environmental conditions may be more suitable for one particular species over another. 


For the next simulation, we were required to add an herbivore into the mix. Since Plant B went extinct, we were instructed to add a population of rabbits into the simulation and have them only eat Plant A. After a 100 day simulation, the population of Plant A slightly increased while Plant B was able to remain alive and only lost approximately half of its original population. Adding an herbivore into the ecosystem allowed both plants to exist and added to the overall health of the environment. 


We then moved on to the second portion of the lab on the food web. For the first activity in this section, we were instructed to add an omnivore and a predator into the mix. We had to have Predator A eat Omnivore A, Omnivore A eat Herbivore A, and Herbivore A eat Plant A. Plant B was to be left untouched by any other organism. In this 100 day simulation, the populations of Plant A and Predator A decreased while the populations of Herbivore A and Omnivore A increased. The population of Plant B remained unaffected. Here, I learned the importance of producers. They provide essential nutrients to organisms up the food chain in higher trophic levels as well as ensure the overall health of the ecosystem at large. 


In the final simulation, we were required to hit the “all on” button on the simulator. This made every single organism eat all the organisms below it. With the exception of Predator A, all other organisms either decreased in population size or went entirely extinct. I ran the 100 day simulation twice, and the result remained the same. I learned that energy flows from the lowest trophic level (producers) to the highest trophic level (highest-level consumer within an ecosystem). 


For the final portion of this lab, we were then to create an ecosystem where all organisms had to stay alive. This took a significant amount of effort and collaboration, but after what seemed like hundreds of attempts, I finally found the perfect configuration. A picture is located below. 


After I ran through all the simulators, there was a short reflection piece. Through the completion of this activity, I discovered that ecosystems are incredibly complex. Even the slightest of changes can have detrimental effects. That’s not to say that all changes are negative, but a slight shift in one thing or another can result in a major change overall. Therefore, humans must be considerate with their actions. We are currently causing lots of harm to various ecosystems across the globe. Things such as greenhouse gas emissions and deforestation have catastrophic effects and we must change our ways to live in harmony with all other living organisms on this planet.

Thursday, December 3, 2015

Barn Owl Activity

Today in class, we broke off into small groups and were presented with a math problem. We had to figure out how many acres of grain were needed to feed a two kilogram barn owl. In order to solve the problem, we had to find how many fowls a barn owl eats per year, how much grain a fowl eats a year, and then how many acres were needed to produce that amount of grain in order to come up with an answer. First, my group and I discovered that a two kilogram barn owl eats approximately three fowls per night. When then discovered that fowl eat approximately 4.7 grams of gain each day or 0.0047 kg. After this, we learned that approximately 50 kg of grain can be grown on an acre each year. To figure out how many acres it would take to produce the amount of grain needed, we multiplied the 0.0047 kg of grain a fowl eat a night by three to display the three fowls barn owls eat per night. We then multiplied this by 365 to represent the number of days in a year to get 5.1 kg of grain per 2 kg barn owl per year. We then divided that number by the 50 kg of grain grown per acre per year to find the percentage of an acre needed to produce that amount of grain. We got an answer of 1/10th of an acre or 10%.

Monday, November 30, 2015

Energy Overview Activity

Hello, everyone!

Today was the start of a new trimester. To kick things off, my Honors Environmental Science class broke into small groups and completed an energy chart. The goal of this chart was to test our knowledge of energy along with how it is transferred. The parameters were to sketch how we believed energy transferred from the Sun to an eagle in mid-flight. Below is my group's interpretation. We hypothesized that the thermal energy from the Sun transfers chemical energy to the grass to help it grow. We then hypothesized that that small rodents, like mice, consume the grass in another chemical energy transfer. Then, the eagle consumes mice in yet another chemical energy transfer ignored to have enough energy to fly.


Wednesday, November 18, 2015

Anatomy of Environmental Issues Final Project: Endangered Species

Hello, everyone!

The fall trimester has officially come to a close and I'd like to share with you my final project. Each person in our class spent a large portion of the trimester researching an environmental issue of their choosing that is currently affecting our planet. We were then given the task to share our research in the from of either a research paper or a Google Slides screencast. I decided to research endangered species and I created a screencast to help share what I learned and discovered with you all. I hope you enjoy!


Thursday, November 5, 2015

Global Climate Change Unit

Over the past few weeks, my Honors Environmental Science class has been learning about climate change and its effect on our planet. We started the unit with a short, in-class activity on El Niño. It was in this activity that the class developed a thorough understanding of the severity of climate change along with the difference between climate and weather. Weather is the measure of daily temperature, precipitation, humidity, etc. while climate is the change in weather patterns over extended periods of time. Climate change and the warming of the Earth’s atmosphere also create stronger storms that occur more frequently. This was an incredible way to start out the unit as it was very eye-opening.

After completing the El Niño activity, two climate specialists came to speak with our class; Andra Reed (M.S.) and Dr. Greg Garner (PhD) of the Pennsylvania State University talked about their work studying climate change. The presentation began with Andra Reed where she explained her work studying the effects rising sea levels have on New York City. She went into detail about how climate scientists measure changes in the sea level as well as how they predict the future climate of the region. Her research was even featured in famous publications such as The New York Times. The presentation continued with Dr. Garner. He explained the work he does with studying air quality. Similarly to Andra Reed, Dr. Garner and his team use similar methods to arrive at their conclusions.


We then looked over a climate change presentation created by the Department of Biology and the Department of Geology at West Chester University. The presentation made it so that we were interns working for an imaginary senator. Our goal was to educate our senator on climate change for legislation he was about to pass and we had to start at square one. Here’s what we learned.

Climate was the first thing we learned about; it is the pattern of precipitation, temperature, and wind in a particular area. Climate quickly lead into the discussion on climate change. Climate change is when climate patterns change in time or space. For example, a change in time would be the winter months getting warmer. A change in space would be the occurrence of extreme weather events in areas where they typically do not occur. Climate change is a difficult thing to study, however, because there are so many factors. Climate can be studied in periods of tens, hundreds, or thousands of years and on the local, regional, national, or global levels.

We then learned just how serious climate change is. Climate determines things such as the frequency of extreme weather events, the severity of droughts, the state of human-managed ecosystems like agricultural fields, and the location of biomes (large terrestrial ecosystems). Following our lesson on the severity of the issue, we learned what is causing climate change.


We discovered that temperatures are rising on Earth. While it is normal for our planet to go through gradual stages of warming and cooling, the recent spike in temperature over the past few decades has been rather extreme and far out of proportion compared to other warming and cooling cycles. There is a direct correlation between the rising temperatures and the rise of carbon dioxide. As the temperatures on the planet rise, so do the levels of carbon dioxide. This is because carbon dioxide is a type of greenhouse gas. Greenhouse gases are incredibly important; a portion of these gases get trapped in the Earth’s atmosphere, thus making the planet habitable for life. This is a process known as the greenhouse effect. Greenhouse gasses enter the atmosphere, reflect off the Earth’s surface, and the some go back off into space and some get trapped in by our atmosphere. without the greenhouse effect, humans and many other species would certainly go extinct. The problem is, humans are producing carbon dioxide at incredibly high rates. All this these extra man-made greenhouse gas emissions also get trapped into our atmosphere, and therefore also help raise the temperature of the Earth.


Human activities such as driving cars, flying planes, moving trains, heating homes, lighting streets, growing food, etc all contribute to more greenhouse gas emissions. The results could be (and will be if we do not stop) catastrophic. Just a one degree rise in temperature could cause massive sea level rises, more extreme storms, and the shift of biomes. Rises in temperature can make Pennsylvania feel like Georgia and Georgia feel like a tropical rainforest. Overall, the effects of climate change are detrimental and serious action needs to be taken in order to make a meaningful change in the world. This is our planet and we need to protect it.

Image 1 Source: https://toryardvaark.files.wordpress.com/2010/11/flooded-new-york.jpg
Image 2 Source: https://askabiologist.asu.edu/sites/default/files/image/article/2014/biomes-world.jpg
Image 3 Source: http://72abfb7c1a8a714119014a3d306595cd09781b35fe13ebdb4f63.r27.cf2.rackcdn.com/4C8755B4-B5C2-412D-BB43-16FF536A7514.jpg

Wednesday, November 4, 2015

You. Nature. Discuss. Activity

Today was unseasonably warm. Wearing shorts in November is not a very common occurrence. In fact, this happens so rarely that our teacher let us have some extra fun in class today. We were assigned a prompt titled, “You. Nature. Discuss.” We were then instructed to venture off into the woods within the campus and sit alone for ten minutes. After the observation period, we were to write whatever came into our minds down in our journals. So, without further ado, here are my thoughts:

I chose to sit on a log right alongside the Horseshoe Trail. The log was a moderately sized tree that had recently fallen over. Around me were several thorn bushes along with some moderately sized trees. I sat there and observed my surroundings. The first thing I noticed were the amount of leaves falling from the trees. Most of the leaves still hanging on the the trees were a bright yellow, while the ones laying on the ground were a autumny mix of yellows, oranges, reds, and browns. My mind soon wandered to all the noises. At first, I heard several birds chirping. The sounds of dump trucks from the quarry along with airplanes flying overhead also caught my attention. There were lots of bug sounds too. Of course, the most identifiable sound was of Afrah laughing. I looked to my feet and noticed some green moss growing on the ground. I also noticed some deer running through the forest. Despite all the things happening in the woods, I observed this overall feeling of peacefulness and serenity. It was quite an uplifting experience and I hope we start doing this activity more often as a class.

Sunday, October 25, 2015

Global Climate Change Activity Overview

Over the past week in my Honors Environmental Science class, we have been learning about all things related to climate and climate change. We started out the week discussing the difference between weather and climate as well as discovering the formation of El Niño and La Niña. We then met with Andra Reed (M.S.) and Dr. Greg Garner (PhD) of the Pennsylvania State University where they explained the research they do in regards to climate change and the health of the environment. To conclude our week, we completed a four part lab activity about climate change. An overview of what we learned is below.

We first learned about the difference between climate and weather. Weather is the measure of day-to-day environmental conditions. Elements such as daily temperatures, precipitation amounts, barometric pressure, humidity, etcetera are all examples of weather. Climate, on the other hand, in the measure of weather-related trends over extended periods of time. The change in weather in a particular region over a hundred or a thousand years is an example of climate.

We then learned about the creation of El Niño and La Niña. El Niño occurs in the Pacific Ocean and directly affects the western portion of the United States. The interaction of heat between the atmosphere and the ocean bring cooler, wetter conditions to the South while producing the warmer, drier conditions everywhere else. La Niña produces the opposite effect. It also occurs in the Pacific Ocean, but it causes warmer, drier conditions in the South while creating cooler, wetter conditions everywhere else instead. We discussed El Niño specifically since it is currently occurring, but to a much more extreme extent. Due to the warming of the Earth’s climate (climate change), these weather patterns are happening much more frequently with significantly greater power.


The following day, we met with Andra Reed (M.S.) and Dr. Greg Garner (PhD) from the Pennsylvania State University. The presentation began with Andra Reed telling us all about her study of affect climate change and rising ocean levels will have on New York City. She cited the effects and damage Hurricane Sandy had on the city to convey just how serious this issues is. Her studies about Hurricane Sandy were even featured in reputable news organizations such as The New York Times. She explained to us how even just a one degree celsius increase in global temperatures can have catastrophic effects. The presentation continued with Dr. Greg Garner. He explained to us the work he does with studying air and air pollution. In particular, he explained how carbon dioxide emissions can create heavily polluted air Dr. Garner showed us a recent study on the Baltimore region to show us the seriousness of air pollution and how it damages not only the environment, but also ourselves.

We then began a two-day global climate change lab activity. Everyone in my class was evenly divided into four separate groups - one group per activity in the lab. On the first day, each group worked through their specific lab activity in the packet. One the second day, the groups were reorganized so that each person in the group completed a different activity than their group members. The second-day groups helped each other to complete all the lab activities in the packet. Below is an overview of each activity.

The first activity provided readers with a graph displaying the average temperature of El Niño years. It then asked the reader to explain how weather differed from climate and how climate change affected the extremity of El Niño. It also asked the reader to examine a statement from an imaginary classmate stating that the graph only represented weather and, therefore, it could not prove any change in climate. My group came up with the response that weather affects climate over time. On the first section of the graph, El Niño events are significantly smaller than events on the second portion of the graph. Within the second portion of the graph, the average temperature is significantly higher and El Niño events occur more frequently. We also concluded that the classmate was wrong.

The second activity provided the reader with three graphs displaying the changes in greenhouse gas levels (carbon dioxide, methane, and nitrous oxide) from the beginning of the Industrial Revolution in 1850 to today. It then asked readers to chart the amount of carbon dioxide in parts per million from the year 1850 to 2100. My group concluded that levels of greenhouse gasses such as carbon dioxide have been steadily increasing since the start of the Industrial Revolution. We also determined the humans are primarily responsible for this increase through our use of fossil fuels and that even small increases of carbon dioxide levels can greatly affect the Earth’s climate.

The third activity provided reader with a list of facts in regards to cars, their fuel consumption, and how many pounds of carbon dioxide are released into the atmosphere per gallon of gasoline burned. It then provided readers with a scenario. The packet included a map of 25 students’ houses in an imaginary school district. It then provided the distances each student needed to drive every day in order to get to school. The activity posed the question of whether it would be more environmentally friendly for every student to drive to school or take the bus. My group did the math and made all the necessary calculations. We determined that it is significantly more environmentally friendly for students to take the bus each day. The then calculated how many tons of carbon dioxide could be prevented from being emitted into the atmosphere each week if all 250 students in the district took the bus each day. We were amazed by the fact that students could prevent 743.4 tons of carbon dioxide from being emitted each week just by taking the bus. This activity was particularly eye-opening because it showed us just how easy it is to make a meaningful difference.

The fourth activity provided readers with a graph charting the change in the Earth’s temperatures over the past 2,000 years. We saw that the Earth is about to reach the highest temperature it has ever seen in the past 10,000 years just due to the greenhouse gas emissions humans have produced over the past 150 years. My group concluded that even the slightest change in temperature can cause devastating effects such as sea level rises and loss of glaciers.

Overall, this week in Honors Environmental Science was very interesting. Climate change is a serious problem that needs to be addressed. This activity really put things into perspective. Climate change is happening now and has a detrimental impact on our lives. Storms are occurring more frequently and with more severe effects. Sea levels are rising and damaging our cities and our coastal habitats. We need to make the necessary changes in our lifestyle to prevent any further damage and protect our planet from the destruction we are causing.

Image Source: NOAA

Tuesday, October 20, 2015

Endangered Species Brief

Over the past few days, I have been conducting research towards my endangered species project. I have collected a plethora of resources and information from a wide variety of reputable sources such as the World Wildlife Fund, National Geographic, and several government agencies. Through my research into this environmental issue, I have uncovered the who, what, where, when, and why. Here is what I found.


The first question I needed to answer was who is creating this problem. The answer was us, the human beings who live on this planet. Our actions result into the endangerment and, occasionally, the extinction of various species. Things such as man-made global warming cause temperature changes killing off large portions of a population like polar bears in the arctic circle. Other activities such as deforestation and other types habitat destruction also have a profound affect on the other species that inhabit the Earth. Things such as overpopulation could result in the need for more housing which results in the destruction of more wild habitats which result in more endangered species as well. Poaching is also a large contributing factor.


The second question was what is causing this issue. The answer blends in with my response to who. Our actions are what is primarily causing this problem. Things such as pouching, over-hunting, habitat destruction, pollution, global warming, etcetera all have major effects on some species, thus causing them to become endangered. The numbers of certain species living in the wild is down to the hundreds for some. That means that scientists know exactly how many are left. They have a definitive number as to how many animals of an endangered species live in the wild. Rhinos are being poached in the African savannah for their horns while Polar Bears are losing crucial habitats due to ice melt in the arctic.

The third question was where is this issue taking place? One cannot pinpoint a certain location on the globe as to where this problem is occurring. Endangered species exist everywhere across the world. There are most certainly areas of high concentration where a vast number of various endangered species exist, but the short answer is that the reduction of species is happening everywhere.

The fourth question is when did this start happening. The answer is fairly recent. Endangered species started to be noticed and addressed around the 1960’s. This is when the World Wildlife Fund began. They started to collect data and coordinate responses to the crisis. Also during this time, the first laws were passed in the United States Congress to address the issue of endangered species.

The final question that needed answering was why does this happen. This answer is also difficult to pinpoint. Perhaps the reason is lack of care or greed by humans. We consume a large amount of resources and thing very little of the consequences. Some people are over-run with greed and will stop at nothing to make a profit. Either way, something detrimental to our planet is happening and it needs to be addressed. We need to stop things such as man-made global warming, deforestation, habitat destruction, etc. in order to make a truly meaningful difference.

Image 1 Source: https://pbs.twimg.com/profile_images/428200758945652736/ekwCxl6Z_400x400.png
Image 2 Source: http://www.polarbearsinternational.org/sites/default/files/styles/media_full/public/00473-10104_0.jpg?itok=uv9Mr5rz

Wednesday, September 30, 2015

Carbon Cycle Simulation - Part 2

1.) An increase in fossil fuel consumption would result in an increase in carbon in terrestrial plants. The flora population would grow or expand since flora depends on carbon to survive and there would be an excess of carbon in the Earth's atmosphere. If this were to continue for another twenty years, then the number of plants on the planet would increase significantly.

2.) An increase in total carbon concentration from smokestacks would also increase the amount of carbon in the ocean’s surface. Some marine life may be harmed by this increase since some species are not used to handling such a drastic change in their environments. Other species may thrive, such as plants, since they depend on carbon to survive.

3.) Carbon may also be found at the bottom of the ocean or high up in the Earth’s atmosphere. In fifty years, we could find excess carbon in both of those spaces, especially the bottom of the ocean.

4.) The areas most affected by the burning of fossil fuels are the Earth’s atmosphere, the planet’s supply of oil and gasoline, and terrestrial plants. An increase in carbon in the atmosphere is harmful to the planet because it accelerates the greenhouse effect, thus further warming the planet - causing extensive damage across the globe. A decrease of the oil and gasoline supply is also detrimental at the moment. Fossil fuels play a very large role in the way humans live their lives. If we run out and we do not replace our primary fuel source, serious consequences will occur. An increase in carbon in terrestrial plants is beneficial to the plants because plants require carbon to survive.

Tuesday, September 29, 2015

Carbon Cycle Simulation - Part 1

1.) If only half the flora in the world existed in 2110, then the amount of carbon in the Earth’s atmosphere would double. If there is less plant matter to absorb carbon dioxide and convert it into oxygen, then there will be more carbon in the atmosphere. I would change the online simulation to reflect this new information by decreasing the amount of flora within the simulator.

2.) Carbon in the ocean is carbon that fell directly into the ocean water. Carbon in the soil in carbon that fell directly onto the Earth’s surface. Carbon could also be transferred into the soil if an organism dies and then decomposes into the soil.

3.) There is most certainly a linear correlation between the amount of fossil fuels we burn and the amount of carbon in the atmosphere. The more fuel we burn, then the more carbon there will be.

Sunday, September 27, 2015

Environemntal Awareness Activity

Hello everyone!

Last week my classmantes and I completed this super cool enviornmental awareness lab. Be sure to check it out my presentation on the project!

Tuesday, September 15, 2015

Geologic Time Scale

Over the past few days, a couple of my classmates and I created a digital geologic time scale of the Earth’s history. We used a Google image to illustrate just how large our planet’s time scale is. The amount of time you need to spend scrolling through the document represents the amount of time that passed between key events in the past. In order to get the most out of the experience, please click on this link: Geologic Time Scale.

Once you do that, find the magnifying glass icon at the top of you screen in the toolbar, click on the icon, and then scroll over the time scale. Click over the time scale approximately three to five times, select the mouse cursor icon in the toolbar, and then scroll through it at your leisure.

I definitely learned a lot by completing this project. It is very difficult to visualize exactly what 4.6 billion year looks like. This time scale served as a wonderful visual aid. It really helped put thing into perspective. I was surprised by the fact that humans have only been on this planet for a relatively short period of time. I was also intrigued by the fact that other complex life forms are a fairly recent addition in the grand scheme of the Earth’s time scale. This time scale really helped me develop a clearer understanding - I hope it is able to do the same for you.

The geologic time scale can be viewed through an analogy as well. Take a cross country road trip for example. The timeline of the Earth could be represented as a road trip where one drives from the east coast to the west coast. The origin of the Earth would be when I start my adventure in Bucks County, Pennsylvania (just outside Philadelphia), the oldest known Earth rocks would have formed as I reach Pittsburgh and the Ohio state border (approximately a six hour drive from my house), the appearance of algae and bacteria would occur once I arrive in Indiana, early shelled organisms would form as I approach Chicago, the beginning of the Jurassic period would begin as I cross over the Mississippi River, the Rocky Mountains form as I cross over the Rocky Mountains, and modern humans start to appear as I dip my toes in the Pacific Ocean. To better visualize this analogy, please refer to the map of the United States below.


Image Citation:
Map -http://www.worldmapsonline.com/images/academia/murals/academia_us_physical_mural_lg.jpg

Sunday, September 13, 2015

Early Earth Reflection

The Habitable Planet Section One video was very informative about how the Earth transformed drastically from an uninhabitable planet to one that can easily sustain life. It explained how our planet was not always the place we know it to be now and how complex life forms are a relatively recent addition to the overall timeline of the Earth. The two main reasons why the Earth became habitable for complex life forms were due to the stabilization of the planet’s temperature with the greenhouse effect and the rise of oxygen levels.

While I was familiar with some of the topics mentioned in the video, I did not know that complex organisms were a relatively new addition to the planet - only starting to appear 550 million years ago. I also was not aware of the fact that the Earth was once completely covered in ice and had similar conditions to Mars. I’m still a little unclear as to when major events such as ice ages occurred in relativity to the timeline of the planet. While the video did a very nice job explaining why ice ages occur, it did not really tell us when they occurred.


I knew a little bit about the greenhouse effect prior to watching this video, but I did not know much about the entire carbon cycle behind it. The scientists in the video quite obviously knew what they were talking about, but brushed over the carbon cycle rather quickly. I would have liked the video to have gone a little more in-depth with a topic as complex and interesting as the carbon cycle. It is essentially the reason we exist today and I feel like the video could have spent more time explaining it.


I did learn a lot of new information from the video though. One of the things that really caught my attention was exactly how important geology is to better understanding our planet. Geologists can use rocks to explain almost the entire history of the Earth. They use rocks to determine things such as ice ages and oxygen level increases. They also use the rocks to find fossils and piece together various species’ evolutionary history. I was incredibly fascinated by all of this and cannot wait to learn more!

Image Citations:
Snowball Earth - http://images.spaceref.com/news/oosnowball.earth.2.jpg
Carbon Cycle - http://www.esrl.noaa.gov/gmd/outreach/carbon_toolkit/images/carbon_cycle.jpg